Overview of USDA Winter Hardiness Zones
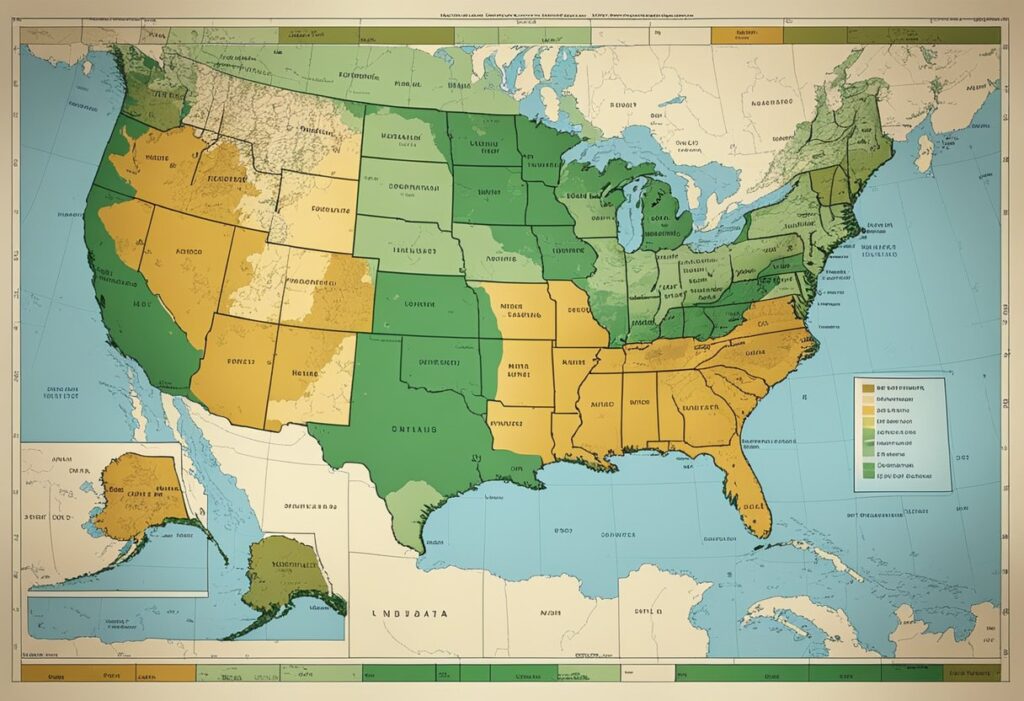
The United States Department of Agriculture (USDA) Winter Hardiness Zones are a standard that helps you determine which plants are most likely to thrive at your location. The map divides North America into 13 primary zones based on the average annual extreme minimum winter temperature.
How it Works:
- Temperature Ranges: Each zone is defined by a 10-degree Fahrenheit temperature range. They are further subdivided into ‘a’ (warmer) and ‘b’ (colder) segments for a more precise classification.ZoneTemperature Range (°F)1a-60 to -55……13b65 to 70
- Zone Numbers: Lower zone numbers indicate colder climates, with lower extreme minimum temperatures. For example, Zone 1a represents the coldest with temperatures down to -60°F, while Zone 13b represents the warmest areas.
- Reference for Planting: You can use the zone designations to assess whether a particular plant will withstand winter in your region. Plants are often labelled with a zone rating to guide your planting choices.
Map Updates: The USDA periodically updates the Plant Hardiness Zone Map to reflect climate trends. The most recent map considers 30-year averages of winter low temperatures and offers guidance on perennial plant survival across the country.
Defining Hardiness Zones
Hardiness Zones are a critical guide for determining the plants best suited to your local climate.
Zone Characteristics
Each hardiness zone reflects areas with similar average annual extreme minimum temperatures. Knowing your zone helps you choose plants that can weather your region’s coldest periods.
- Zone Accuracy: Zones are categorized by the average annual extreme minimum temperatures rather than rare cold extremes.
- Subdivisions: Each zone is further divided into ‘a’ and ‘b’ segments, representing warmer and cooler areas within the zone.
Temperature Ranges
The zones are designated in 10°F increments, with further 5°F subdivisions for fine-tuning.
USDA Hardiness Zones
| Zone | Temperature Range (°F) |
|---|---|
| 1 | Below -50 |
| 1a | -60 to -55 |
| 1b | -55 to -50 |
| … | … |
| 13 | Above 60 |
| 13a | 60 to 65 |
| 13b | Above 65 |
Climate Variability
Your hardiness zone is a starting point, not an absolute. Microclimates and yearly variations affect plant survival and growth.
- Microclimates: Areas within your property could be warmer or cooler than the general zone indicates.
- Yearly Fluctuations: Annual weather changes mean some years are harsher or milder than the average.
Usage and Applications
The USDA Plant Hardiness Zone Map is a fundamental tool that guides your plant selection, informs agricultural practices, and assists with climate adaptation strategies.
Plant Selection
When selecting plants for your garden, refer to the Hardiness Zone Map to ensure compatibility with your local climate. Plants are categorized by the zones they can thrive in, indicated by a range from 1 (coldest) to 13 (warmest), with each main zone divided into ‘a’ and ‘b’ subzones. This system helps you choose plants that are most likely to succeed in your area.
Gardening and Agriculture
For gardening and agricultural planning, knowledge of your specific zone can inform planting schedules and crop selection. It can determine:
- The variety of perennials that will survive winter in your area.
- When to safely plant annuals without the risk of frost damage.
- Which trees and shrubs are best suited to your region’s climate extremes.
Climate Adaptation
Understanding your hardiness zone is critical for long-term planning and climate adaptation:
- Develop landscaping strategies that require less water in areas prone to heat increases.
- Adjust agricultural practices in anticipation of changing climate conditions.
- Anticipate potential pest and disease issues that may arise as zone boundaries shift.
Zone Mapping and Updates
Understanding the USDA Winter Hardiness Zones is crucial for making informed decisions about planting and agricultural activities. These zones provide a guide for what plants are likely to thrive in your location based on climate conditions.
Methodology of Mapping
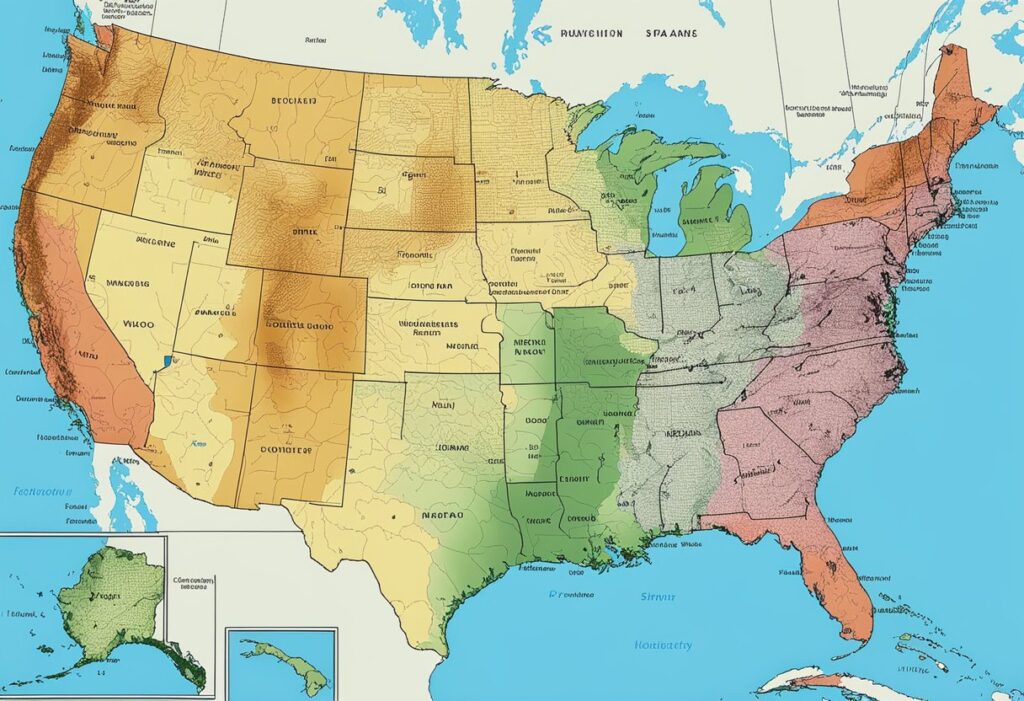
The average annual extreme minimum winter temperature organizes the USDA Plant Hardiness Zone Map. The zones are delineated in 10-degree Fahrenheit increments, with each zone further divided into 5-degree Fahrenheit half zones for more precision. This data is accumulated from various weather stations over a certain period to ensure accuracy.
Recent Changes and Updates
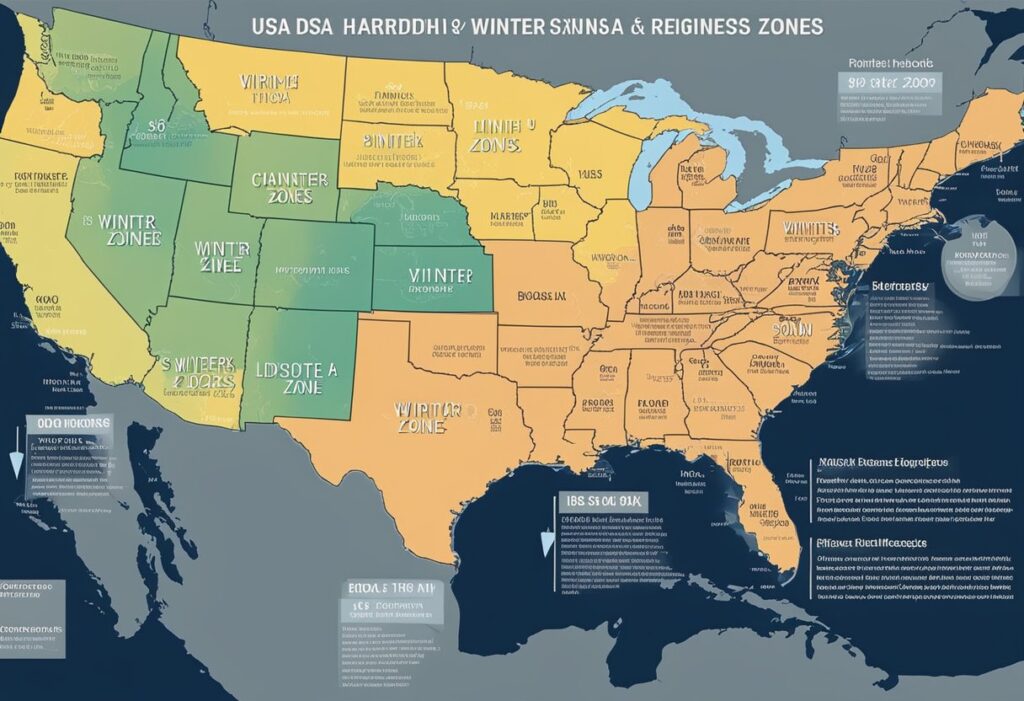
The USDA released a revised Plant Hardiness Zone Map in November 2023. This update reflects shifts in climate patterns and temperature averages. Notably:
- The Zone Map: This map demonstrates a warming trend, with the continental U.S. averaging about 2.5 degrees Fahrenheit warmer than the previous map.
- Impact: These updates might change your planting decisions, with some areas now suitable for plants that previously couldn’t thrive there.
Frequently Asked Questions
This section provides specific information on identifying and understanding USDA winter hardiness zones and selecting appropriate plants for your area based on these designations.
How can I find my USDA winter hardiness zone using my zip code?
To discover your USDA winter hardiness zone, enter your zip code into the USDA Plant Hardiness Zone Map tool available online. This resource will provide your specific zone, helping you make informed planting choices.
Where can I access the latest USDA plant hardiness zone map?
The newest USDA Plant Hardiness Zone Map is available on the United States Department of Agriculture’s website. This map reflects the most current climate data and includes updates made to the zones based on recent climatic patterns.
What are the changes in planting zones from 2012 to 2024 according to the USDA?
Since the 2012 version, the USDA Plant Hardiness Zone Map has expanded to include thirteen zones instead of eleven, adding new regions in Hawaii and Puerto Rico. Adjustments also reflect more granular data on climate variations, improving zone accuracy.
How does the USDA categorize the different winter hardiness zones?
The USDA defines winter hardiness zones by the average annual extreme minimum winter temperature, divided into 10-degree Fahrenheit full zones and further split into 5-degree Fahrenheit half zones, ranging from zone 1 (the coldest) to zone 13 (the warmest).
How can I determine the suitable plants for my USDA hardiness zone?
Once you know your USDA zone, choose plants that are rated for that zone or colder. The zone indicates the lowest temperatures a plant can tolerate, so selecting plants with equal or lower zone ratings ensures they are appropriate for your climate.
What are the key factors that influence the classification of USDA winter hardiness zones?
The classification into USDA winter hardiness zones considers several factors. These include average annual minimum winter temperatures, climate variability, and regional weather patterns. Long-term climatic data is used to assess these factors.


